
November 30, 2018
Dear Fellow Shareholders:
With the passage of The Tax Cuts and Jobs Act, and the continuation of strong incremental pretax corporate profit margins, corporate profits surged in 2018. Stock prices rose more modestly than did profits, meaning price/earnings multiples contracted. This is not surprising, as the market looks ahead, and discounted the news of the fatter profits in advance. So why did stock multiples contract? There are a couple plausible explanations. One is that the market grew increasingly concerned about the United States trade policy - specifically toward China.
Each side has imposed tariffs on imports from the other nation, a game of tit for tat that has shown no sign of ending. As we have written about on numerous occasions, this burgeoning trade war concerns us, as it threatens to upend the economic status quo – a status quo that has been characterized by booming corporate profits that were created to a significant degree by the ability of American companies to take advantage of global supply chains and also to move production offshore. Analysts or reporters sometimes publish simple calculations that indicate a small impact of tariffs on economic output. These are dangerously misleading, as they fail to account for all the effects of such policy.
Another possible drag on stock returns over the past year was rising interest rates. As the economy has expanded and inflation has edged higher, the Federal Reserve has raised short-term lending rates, which acts as a headwind on economic growth. In addition, the rise in longer-term rates such as those on mortgages has not only made home purchases more expensive but has acted as a disincentive for homeowners to trade up, as one would have to switch from a mortgage that was likely locked in at a much lower rate to one based on higher prevailing rates. This lack of home turnover has deprived the economy of a natural lubricant.
So given the escalating tariffs and rising interest rates, the market has begun pricing in a reasonable chance of recession. We don’t know how the trade war will play out, but the market’s response to all this seems rational.
Fortunately, before the market sold off and defense and stability came back into favor, Oak made some minor shifts in that direction in some of the funds. This consisted primarily of adding to healthcare, which looked attractive to us. This helped us better weather the autumn correction.
Another noteworthy development during the year was the continued outperformance of “growth” (companies that are growing sales or earnings at high rates) versus “value” (companies that trade at low valuations). Since the beginning of 2017 there has been a large gap in returns between the two groups, though growth gave back a chunk of this in October. In fact, growth stocks have had the upper hand for the better part of ten years, an unusual state of affairs given the superior long-term record of value stocks. We do have some large positions in growth stocks, but on the whole the strength in growth probably hurt us on a relative basis over the past year.
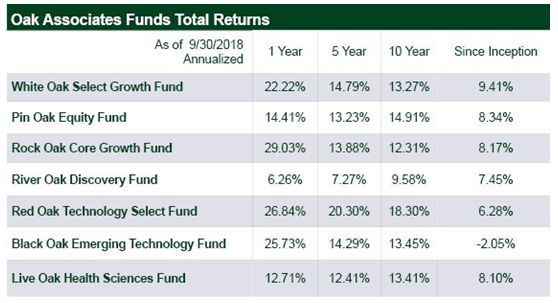
It is interesting to look at returns for the ten years ending October 31, as the starting point is the middle of the 2008 financial crisis. For our three largest funds...
Red Oak’s ten-year cumulative return was 529.68%, versus 380.56% for the Lipper Science & Technology Funds Average. White Oak’s cumulative return was 292.79%, versus 246.68% for the S&P 500 and 276.68% for the Lipper Large-Cap Growth Funds Average. Pin Oak returned 371.46%, versus 207.67% for the Lipper Multi-Cap Core Funds Average and 250.02% for the Russell 3000® Total Return Index. Clearly those that stuck with stocks and resisted the urge to sell during the crisis were rewarded over the long run. Given the different starting point, we expect returns for the next ten years to be much lower.
In large part due to these strong returns, our funds have garnered strong interest from new investors. This goes against the recent industry trend of money flowing away from active managers like Oak and toward passive products like index funds. We are grateful for your business and appreciative of the confidence you have placed in us. You may be interested in visiting our website, www.oakfunds.com, which was re-launched in 2018. It is a good resource for Oak commentaries and recent news.
Best regards,
Mark Oelschlager, CFA
Co-Chief Investment Officer & Portfolio Manager
IMPORTANT INFORMATION
The statements and opinions expressed are those of the author and do not represent the opinions of Oak Associates or Ultimus Fund Distributors, LLC. All information is historical and not indicative of future results and is subject to change. Reader should not assume that an investment in the securities mentioned was profitable or would be profitable in the future. This information is not a recommendation to buy or sell.
To determine if this Fund is an appropriate investment for you, carefully consider the Fund's investment objectives, risk factors and charges and expenses before investing. This and other information can be found in the Fund's Prospectus which may be obtained by calling 1-888-462-5386 or visiting our website at www.oakfunds.com. Please read it carefully before investing.
Mutual fund investing involves risk, including possible loss of principal.Small cap investments typically exhibit higher volatility. Emerging markets involve heightened risks related to the same factors, in addition to those associated with their relatively small size and lesser liquidity.
The performance data quoted represents past performance. Past performance does not guarantee future results. The investment return and principal value of an investment will fluctuate so that an investor's shares, when redeemed, may be worth more or less than their original cost and current performance may be lower or higher than the performance quoted. For performance data current to the most recent month-end, please call 1-888-462-5386.
Total Expense Ratios as of most recent prospectus:
| Gross Expense Ratio | Net Expense Ratio* | |
|---|---|---|
| White Oak | 0.97% | 0.97% |
| Pin Oak | 0.97% | 0.97% |
| Rock Oak | 1.50% | 1.25% |
| River Oak | 1.40% | 1.35% |
| Red Oak | 0.96% | 0.96% |
| Black Oak | 1.16% | 1.16% |
| Live Oak | 1.02% | 1.02% |
*Net Expense Ratios reflect applicable fee waivers and expense reimbursements contractual for a period of one year from the Prospectus dated 02/28/2018.
The Adviser has contractually agreed for a period of one year from the most recent prospectus to waive all or a portion of its fee for the Funds (and to reimburse expenses to the extent necessary) in order to limit Fund total operating expenses. This contractual fee waiver may only be terminated by the Board of Trustees.
The S&P 500 Index is an index of 500 stocks seen as a leading indicator of U.S. equities and a reflection of the performance of the large cap universe, made up of companies selected by economists.
Lipper Science & Technology Funds Average – Funds that invest primarily in the equity securities of domestic companies engaged in science and technology.
Lipper Large-Cap Growth Funds Average – Funds that, by portfolio practice, invest at least 75% of their equity assets in companies with market capitalizations (on a three-year weighted basis) above Lipper’s USDE large-cap floor. Large-cap growth funds typically have an above-average price-to-earnings ratio, price-to-book ratio, and three-year sales-per-share growth value, compared to the S&P 500 Index.
Lipper Multi-Cap Core Funds Average – Funds that, by portfolio practice, invest in a variety of market-capitalization ranges without concentrating 75% of their equity assets in any one market-capitalization range over an extended period of time. Multi-cap core funds typically have average characteristics compared to the S&P SuperComposite 1500 Index.
The Russell 3000 Total Return Index is a market capitalization-weighted equity index maintained by the FTSE Russell that provides exposure to the entire U.S. stock market. The index tracks the performance of the 3,000 largest U.S.-traded stocks.
One cannot invest directly in an index.
To determine if this Fund is an appropriate investment for you, carefully consider the Fund's investment objectives, risk factors and charges and expenses before investing. This and other information can be found in the Fund's prospectus which may be obtained by calling 1-888-462-5386.
Oak Associates Funds are distributed by Ultimus Fund Distributors, LLC. Ultimus Fund Distributors, LLC and Oak Associates Funds are separate and unaffiliated.